
This guide shows you how to use Overbård as an end user once boards have been set up. We also have an admin guide showing how to set up new boards, and a developer guide if you are interested in contributing.
Most of the screenshots for this guide are taken from our read-only demo instance that you can play with to get a feel for the UI without needing to install it to your Jira instance. Try it out and see for yourself!
1 Finding Overbård
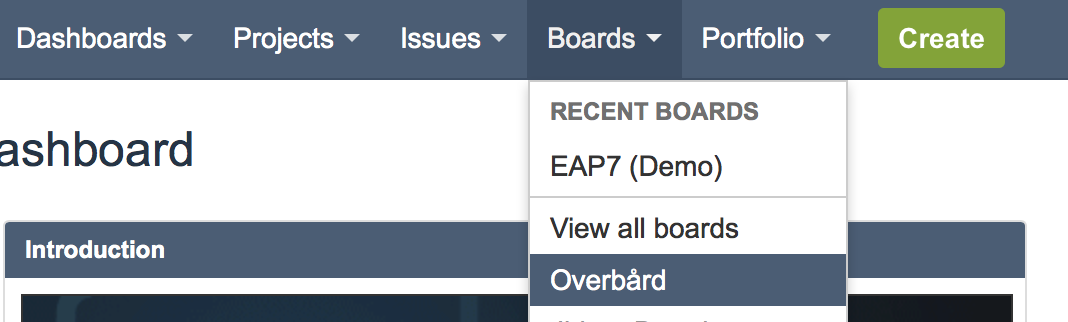
To use Overbård, you need to be logged into your Jira instance. Then click on the
Overbård entry in the Boards menu.
You will then be presented with a list of Overbård boards configured on your Jira instance:
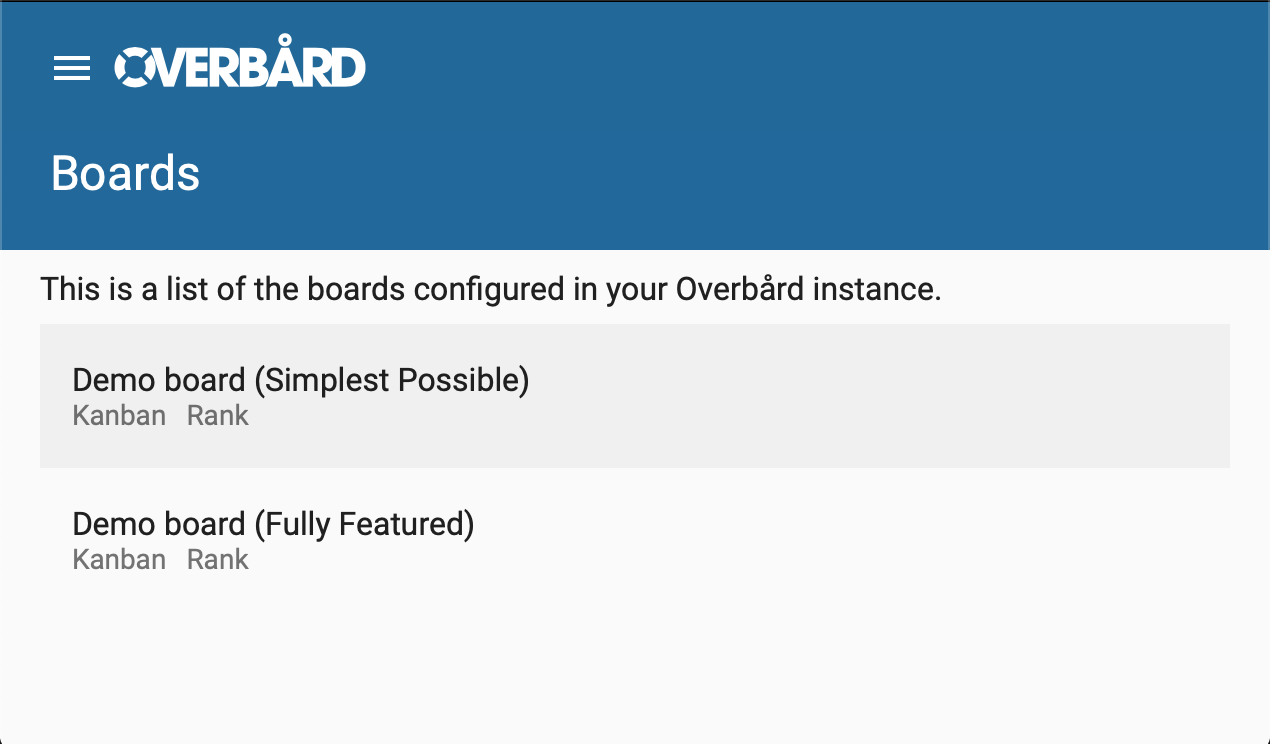
To go to a board click on the name of a board, and you will get taken to it. See the board section for how to work with a board.
1.1 Left menu
If you click on the hamburger icon in the top left, you get presented with the left hand menu. It has the following links:
- Boards - the list of boards configured in your Jira instance, as described in the previous section.
- Config - takes you to where the boards are configured. This is covered in the admin guide, and is out of scope for this user guide.
- Back to Jira - takes you to the host Jira instance.
- Help - takes you to this guide.
- GitHub - takes you to Overbård on GitHub where you can track the progress of the project, create issues in case you find a bug etc.
2 Board
Having clicked on a board in the boards list, you will be presented with a view of the board:
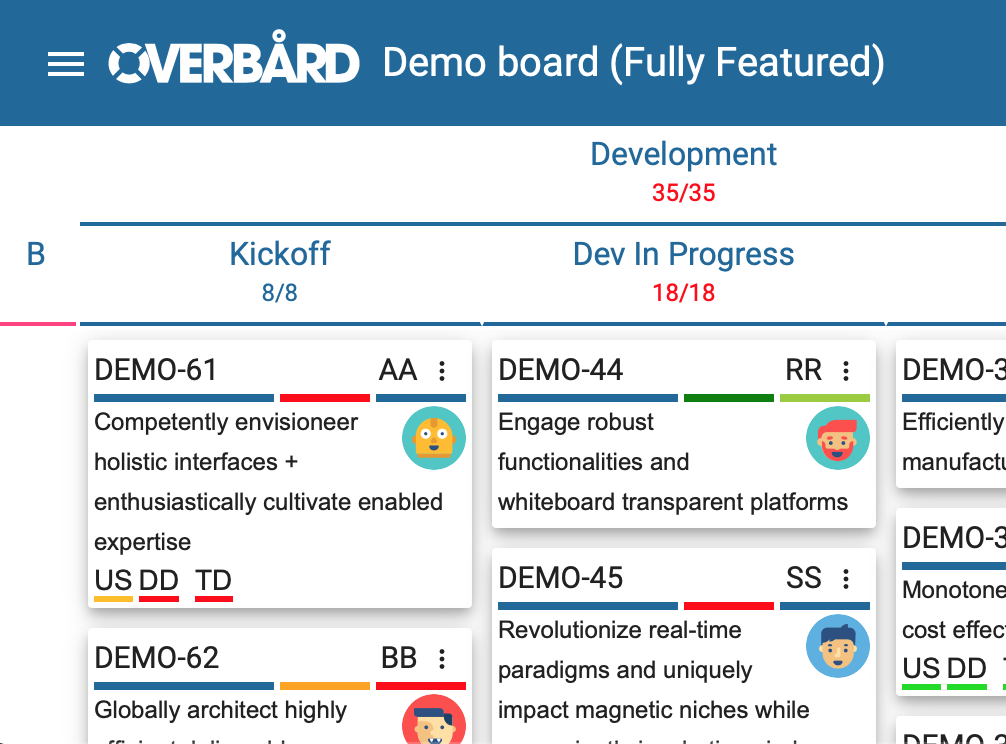
The board is scrollable horizontally and vertically so you can see all issues in all states. If you click on the issue’s key, in the card header, you get taken to the issue in Jira.
The board polls Jira on a regular basis, so changes made to issues on the board will get reflected on the board.
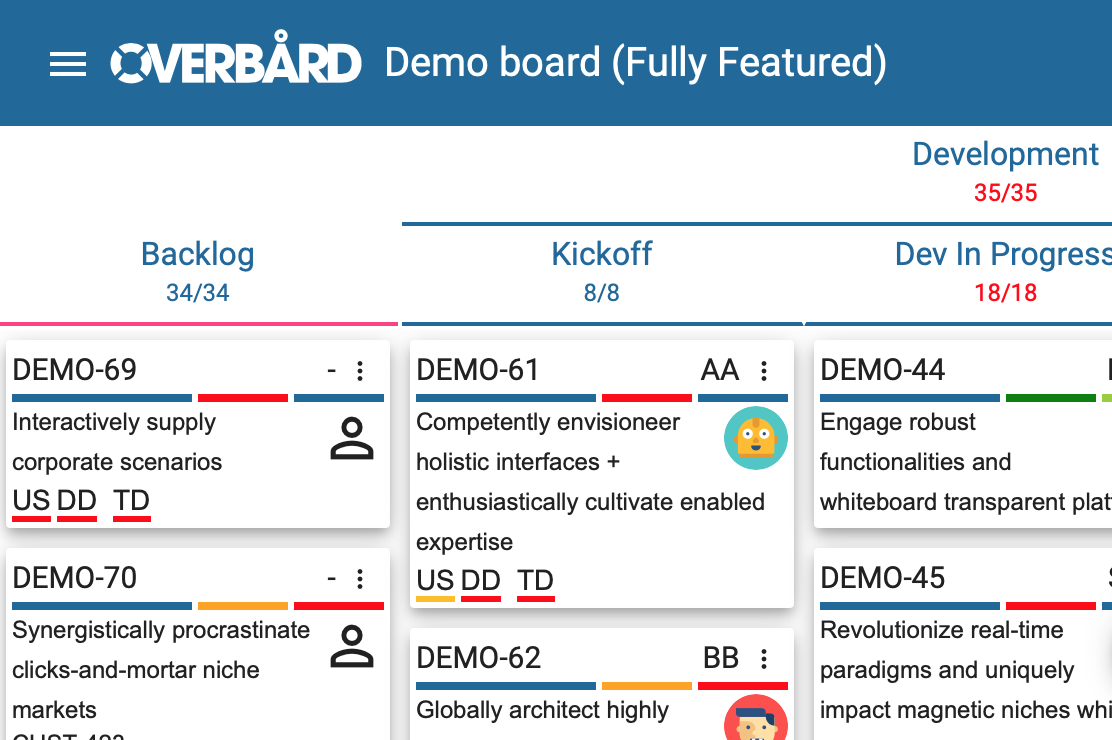
2.1 Backlog and collapsible headers
When you first view a board, the backlog is hidden, as shown in the previous section. To view issues in the backlog, click on the left-most column header and the backlog will be displayed:
Similarly you can expand or collapse any column by clicking on it:
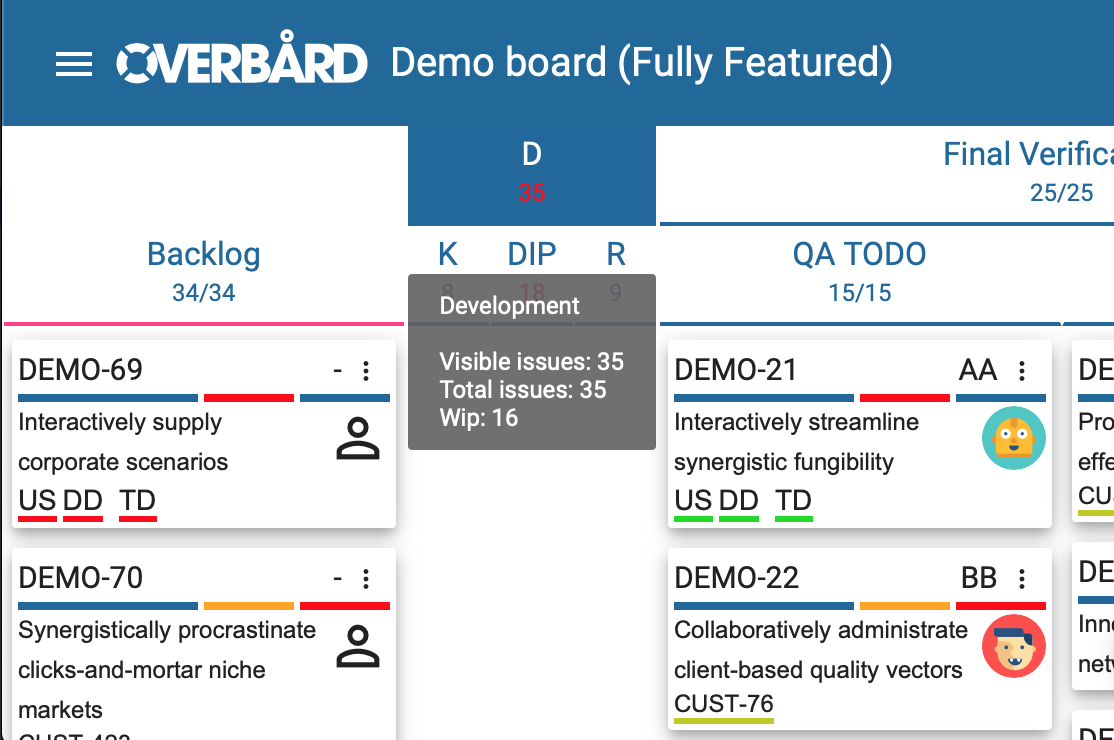
Note that as you collapse and expand columns, the state of what is visible or not is refected in the browser address field so you can share links with fellow users.
2.2 Health panel
If there are some problems in the board’s configuration, an alarm icon will be displayed in the bottom right of the board. Clicking on it displays the health panel, which provides the board administrator with the required information to fix the configuration. This is covered in the admin guide, and is out of scope for this user guide.
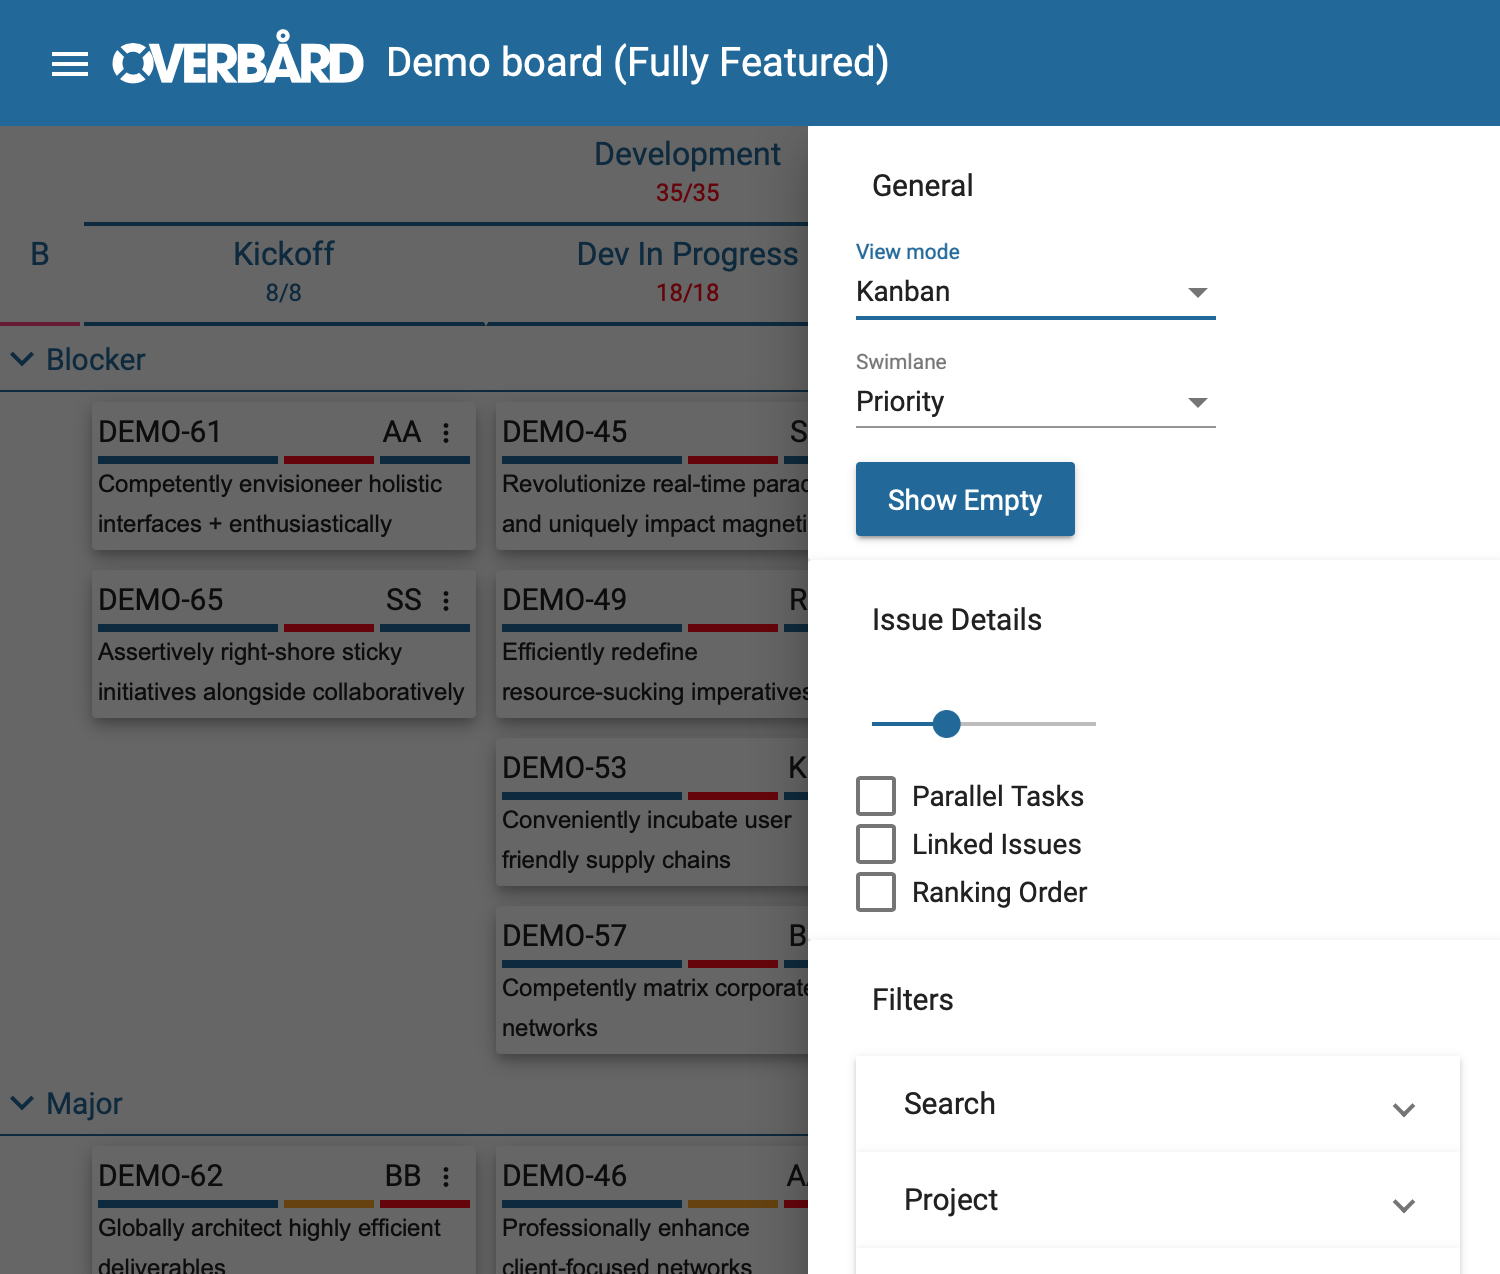
2.3 Control panel
The control panel is the entry point to being able to alter the display of the board at runtime. All the data is tweaked on the client, so there are no extra roundtrips to the server when doing so which makes it very fast. You can select the level of detail to be used when displaying the data, choose swimlanes, and filter the issues. To view the control panel, click on the cog icon in the bottom right of the board. As you make changes to the settings of the board, the browser address field field gets updated with a URL to take you to the currently configured board so you can share links with your friends.
Here is the open control panel:
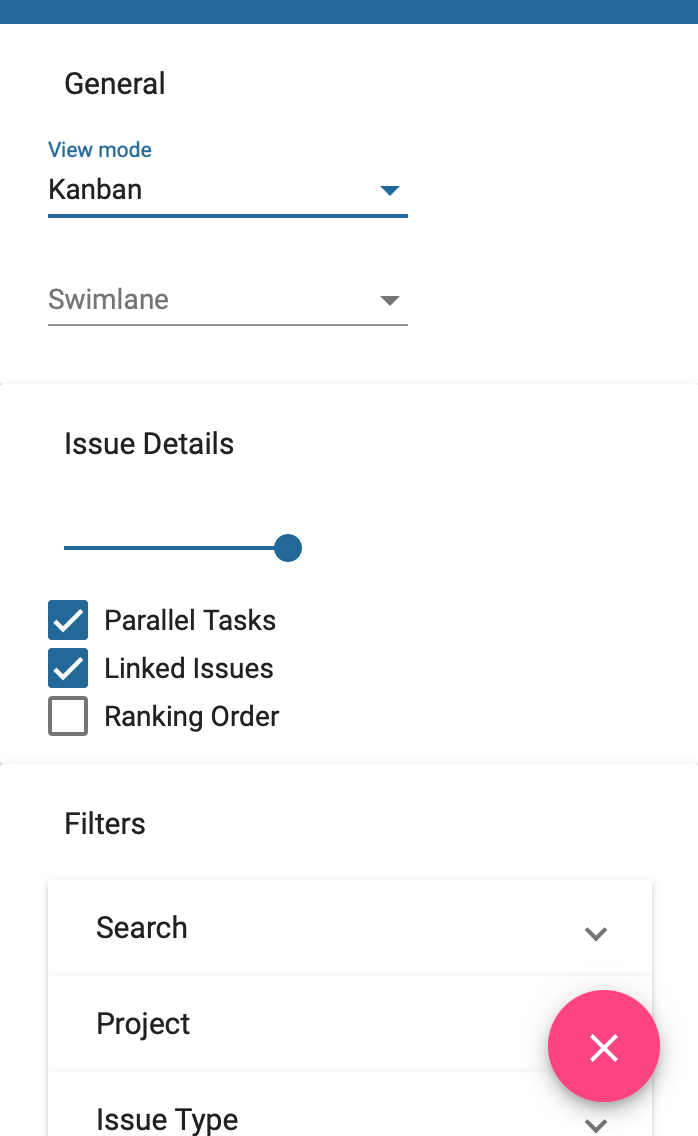
As the number of entries is longer than the window height, the control panel is scrollable. It is divided into 3 main sections:
General- this toggles the viewIssue details- controls the verbosity of what is shown in the issue cardsFilters- used to search for issues
2.3.1 General
This section controls the view of the board. It has two settings:
View Mode- this defaults to theKanbanview which is what we have been seeing so far. The other setting is theRankview.Swimlane- the default is no swimlanes. When the Rank view is shown, this setting is not displayed. On all boards in the Kanban view you can select swimlanes forProject,Issue Type,Priority,Assignee,Component,LabelandFix Version. Also, if the board administrator has configured certain custom fields to be available in the board they will be part of the swimlane options too. Finally, if the administrator has enabled epics,Epicswill show up as one of the choices for swimlanes (The epic swimlanes will be displayed in the order of ranking of the epic issues).
2.3.1.1 Rank view
While the Kanban view is well known, and the standard way of displaying a Kanban board, for huge projects once you have moved issues out of the backlog into other states you lose the global overview of how far issues have progressed with regard to the ranking. For example in the following board (still using the Kanban view):
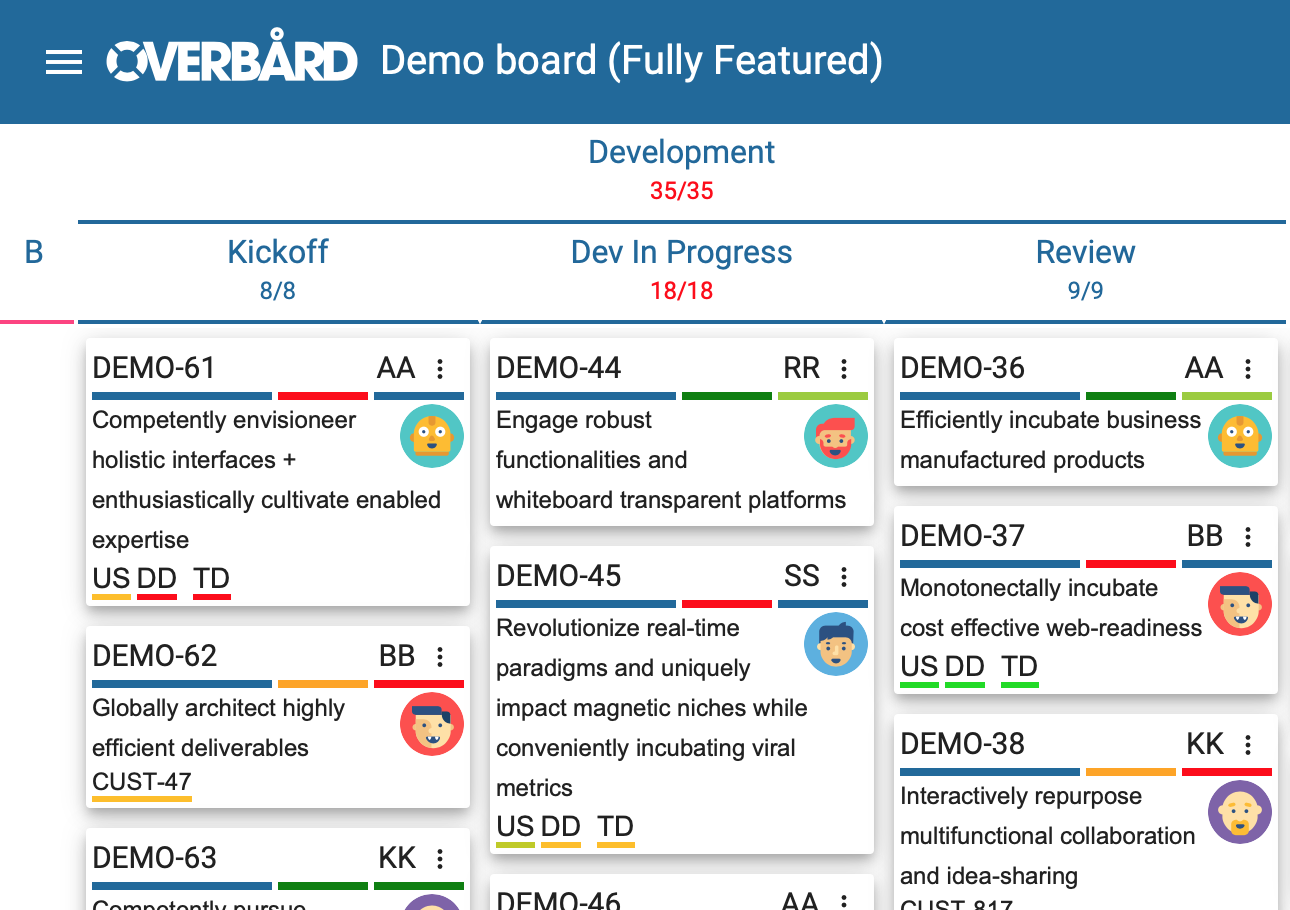
We can see that DEMO-36 is higher ranked than DEMO-37 which in turn has a higher rank than DEMO-38. But we don’t
know how highly ranked these are compared to the issues in the other columns (for example is DEMO-38 really
ranked higher than DEMO-62 and DEMO-44). To find this out, we can switch to the Rank view:
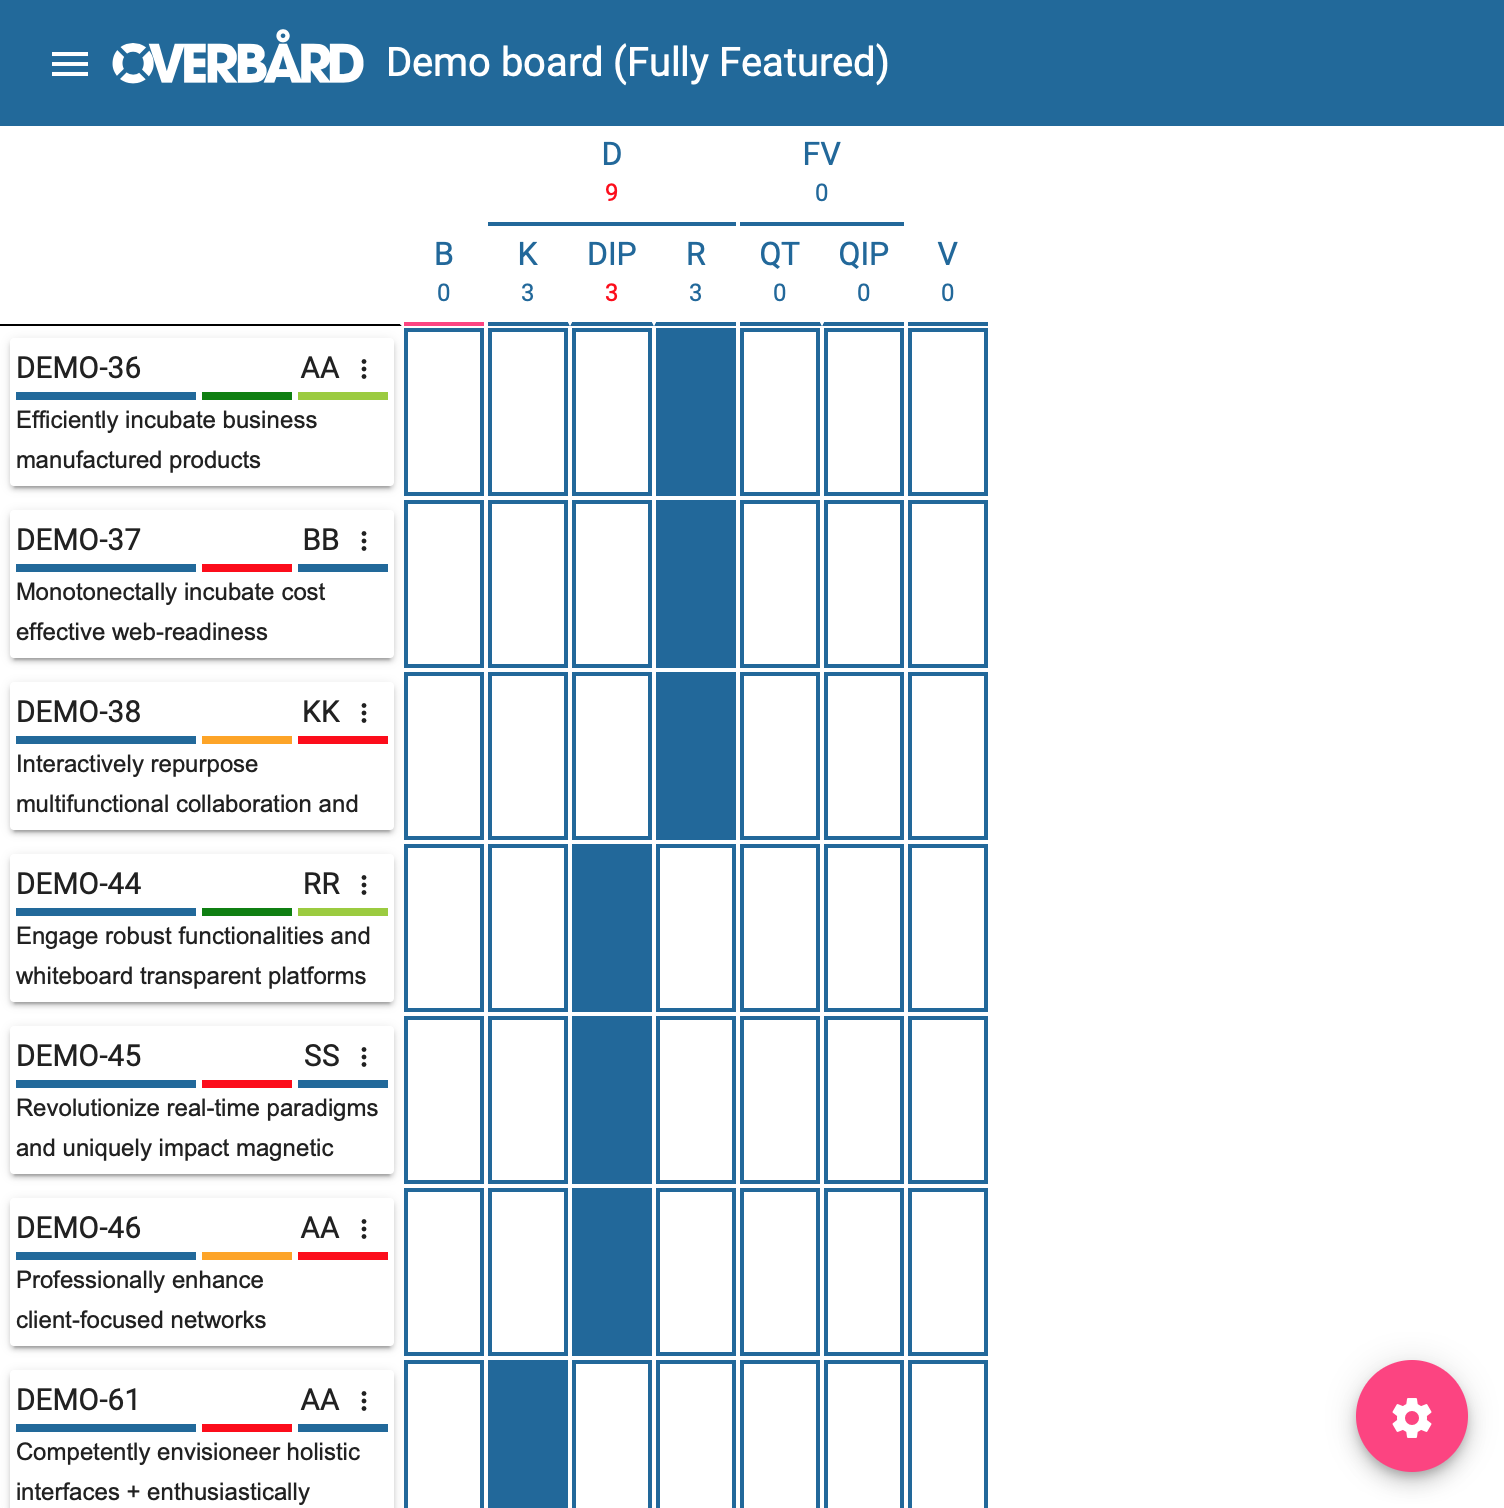
Note that although we have not covered this yet, I have changed the ‘Issue details’ setting so that we see more issues, and also used a filter to pick out the issues from the previous screenshot.
This view shows all the issues in global rank order, along with how far each has moved through the workflow states.
From this we can tell that the DEMO-36 really has a higher rank than both DEMO-62 and DEMO-44,
and as expected is further along in the process. All is good!
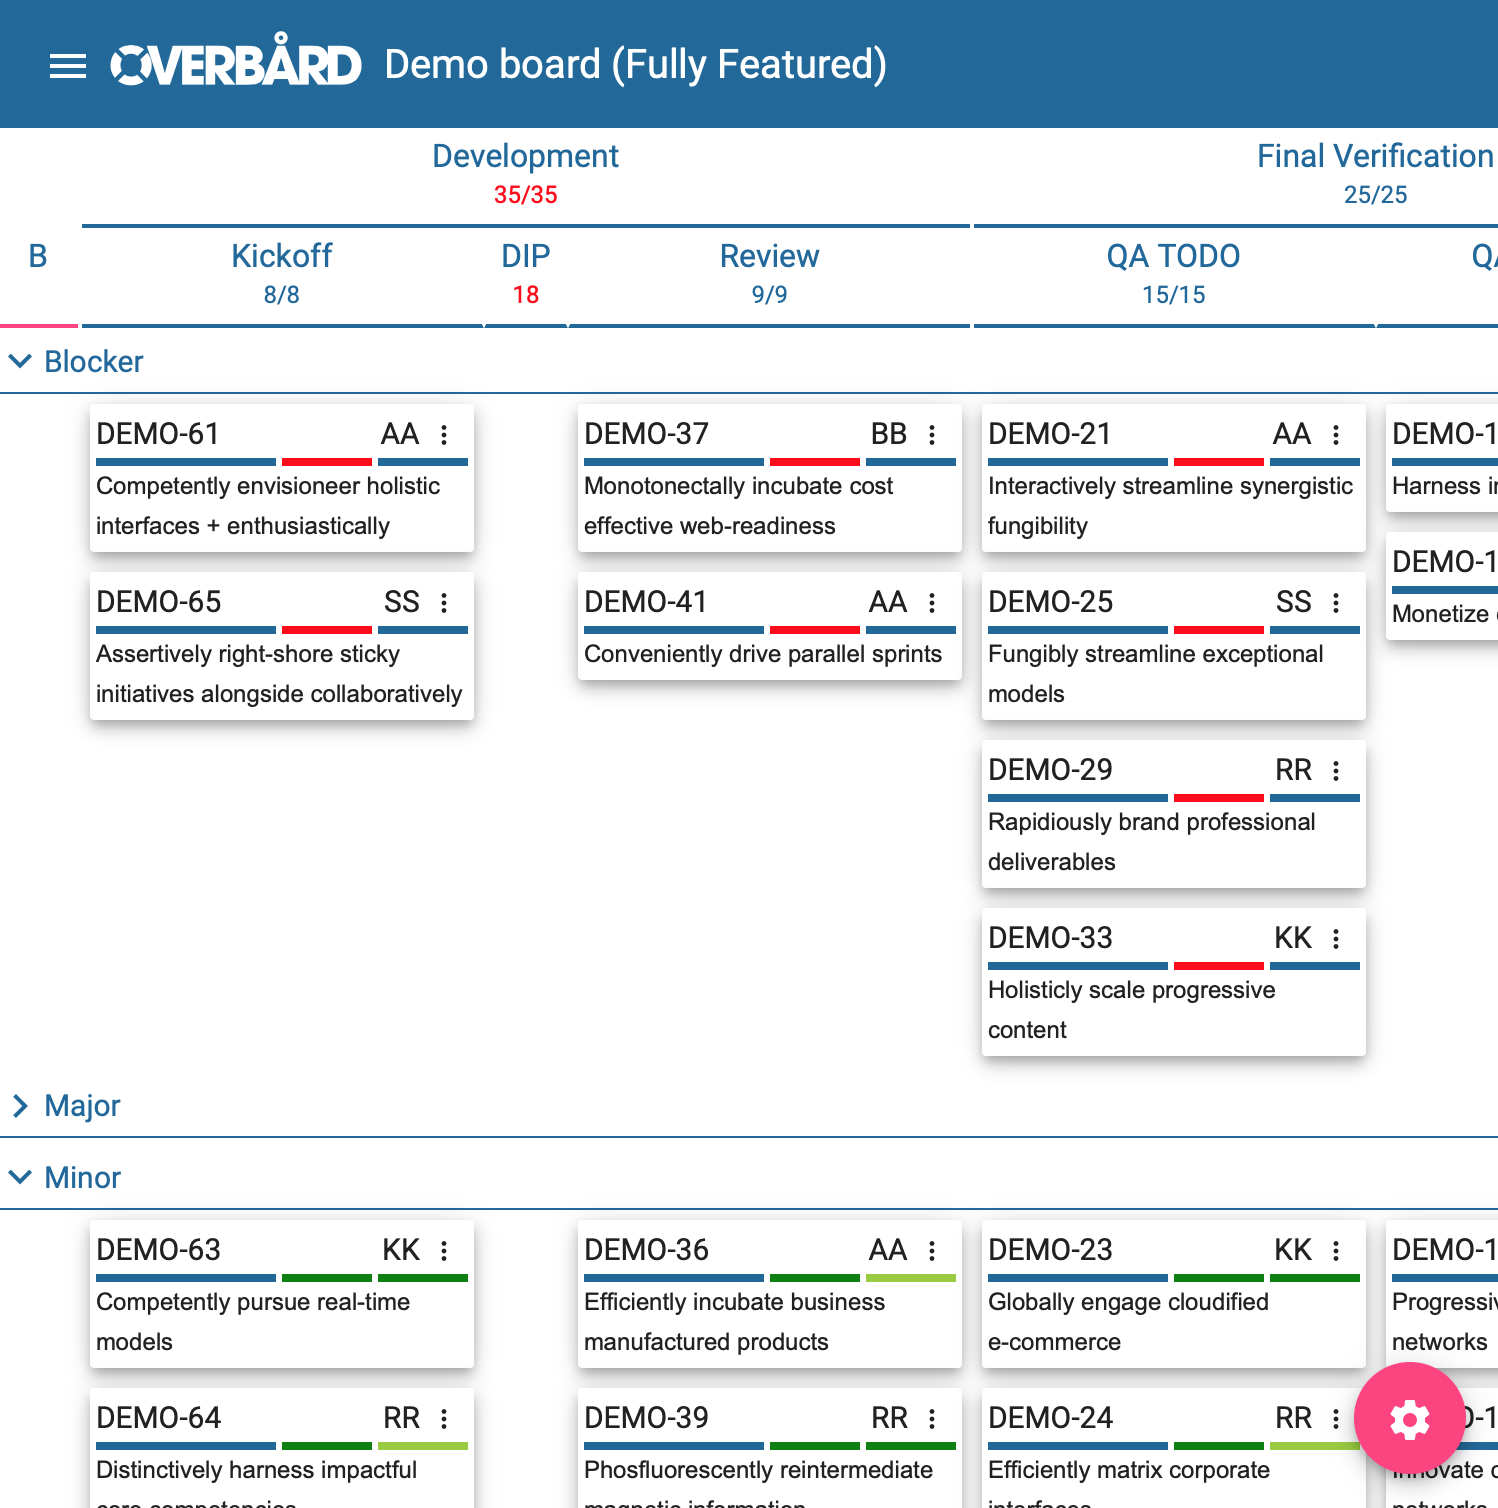
2.3.1.2 Swimlane view
Back in the Kanban view, we can select to display the board using swimlanes. Here I have chosen to display it using swimlanes by issue priority:
By default swimlanes which have no issues associated with them will not be shown. To show empty swimlanes on the
board anyway, click the Show Empty button to toggle this.
Similar to how we can collapse and expand state columns by clicking on the state header, we can collapse and expand swimlanes by clicking on the swimlane header:
Here we have collapsed the Major swimlane and the Dev In Progress state column.
2.3.2 Issue details
By default the issue cards are shown including all the available information. In some cases it can be nice to have a more summarised view. In this section there is a slider to control the amount of information. It has 4 levels:
1) Shows all details, no trimming is performed. This is the default. 2) Trims the description to two lines, and keeps the avatar icon. 3) Trims the description to two lines, removing the avatar icon. 4) Only shows the issue headers.
In addition there are two checkboxes to disable showing the parallel tasks and linked issues sections on the bottom of each card. Note that these are only shown if the board is configured to show parallel tasks and linked issues.
Then there is a checkbox to display the rank order and the total number of issues in the issue cards. As you can see in the following image, when selected this information is shown next to the issue keys in the issue cards:
![]()
2.3.3 Filters and search
The final main section in the control panel is the setting of filters. Click on each of the accordion entries to get a wider view.
On all boards in the Kanban view there will be an entry for Search, Project, Issue Type, Priority, Assignee,
Component, Label and Fix Version. If the board has been configured to use custom fields or parallel tasks, there
will be entries for these as well. The filters work the same in both the Kanban and the Rank views.
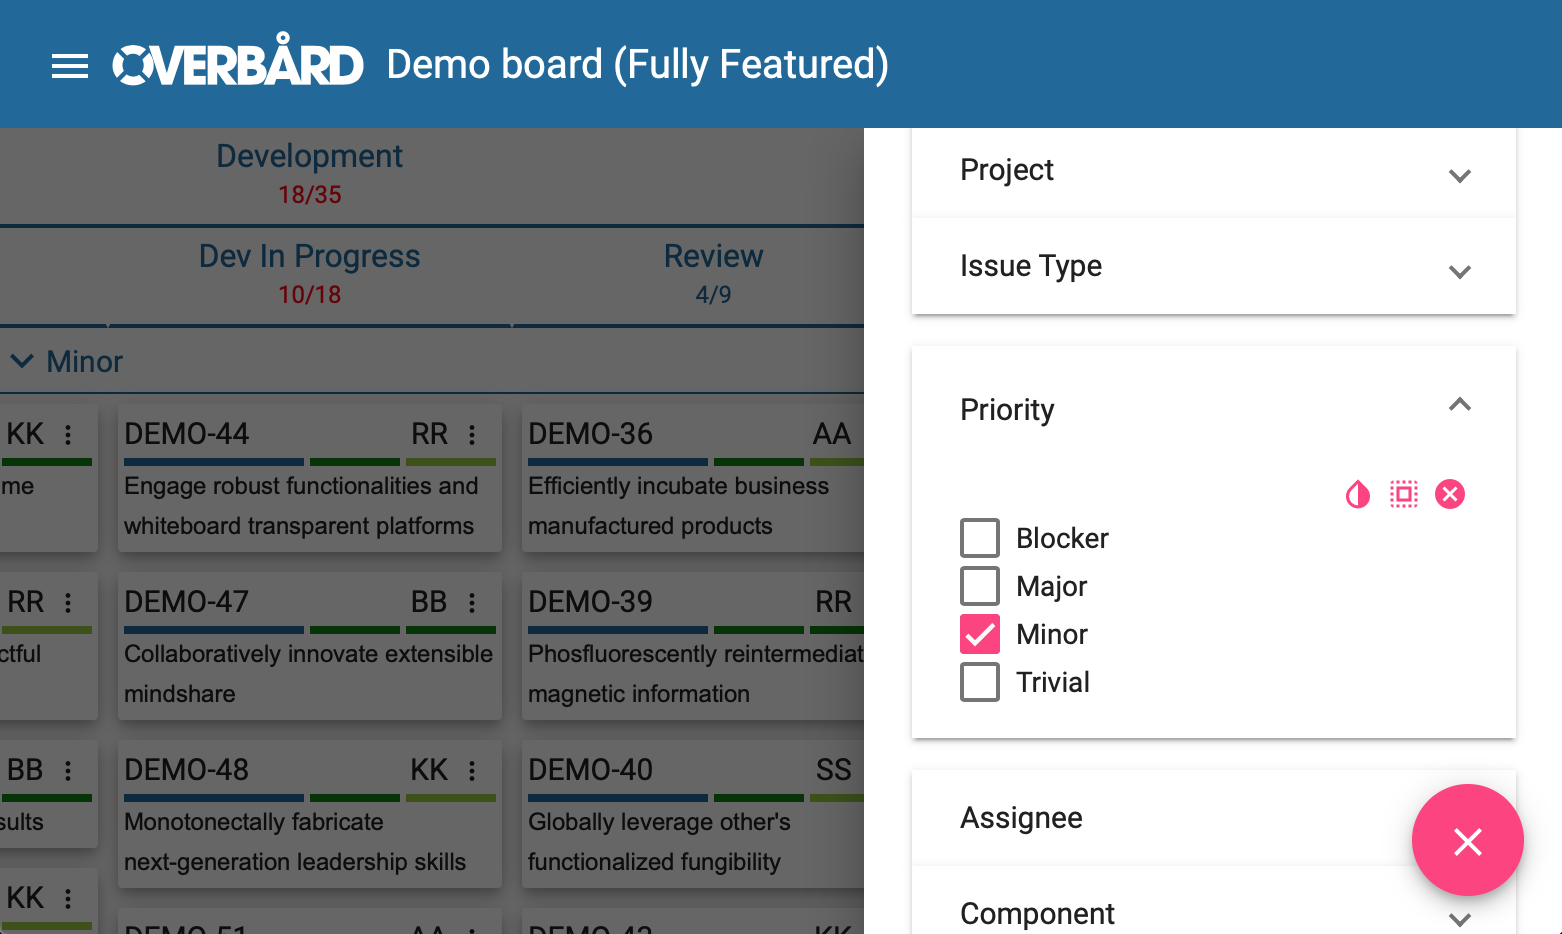
Within each filter entry there is an OR relationship. So if you have selected issue types ‘Bug’ and ‘Story’ as shown here:
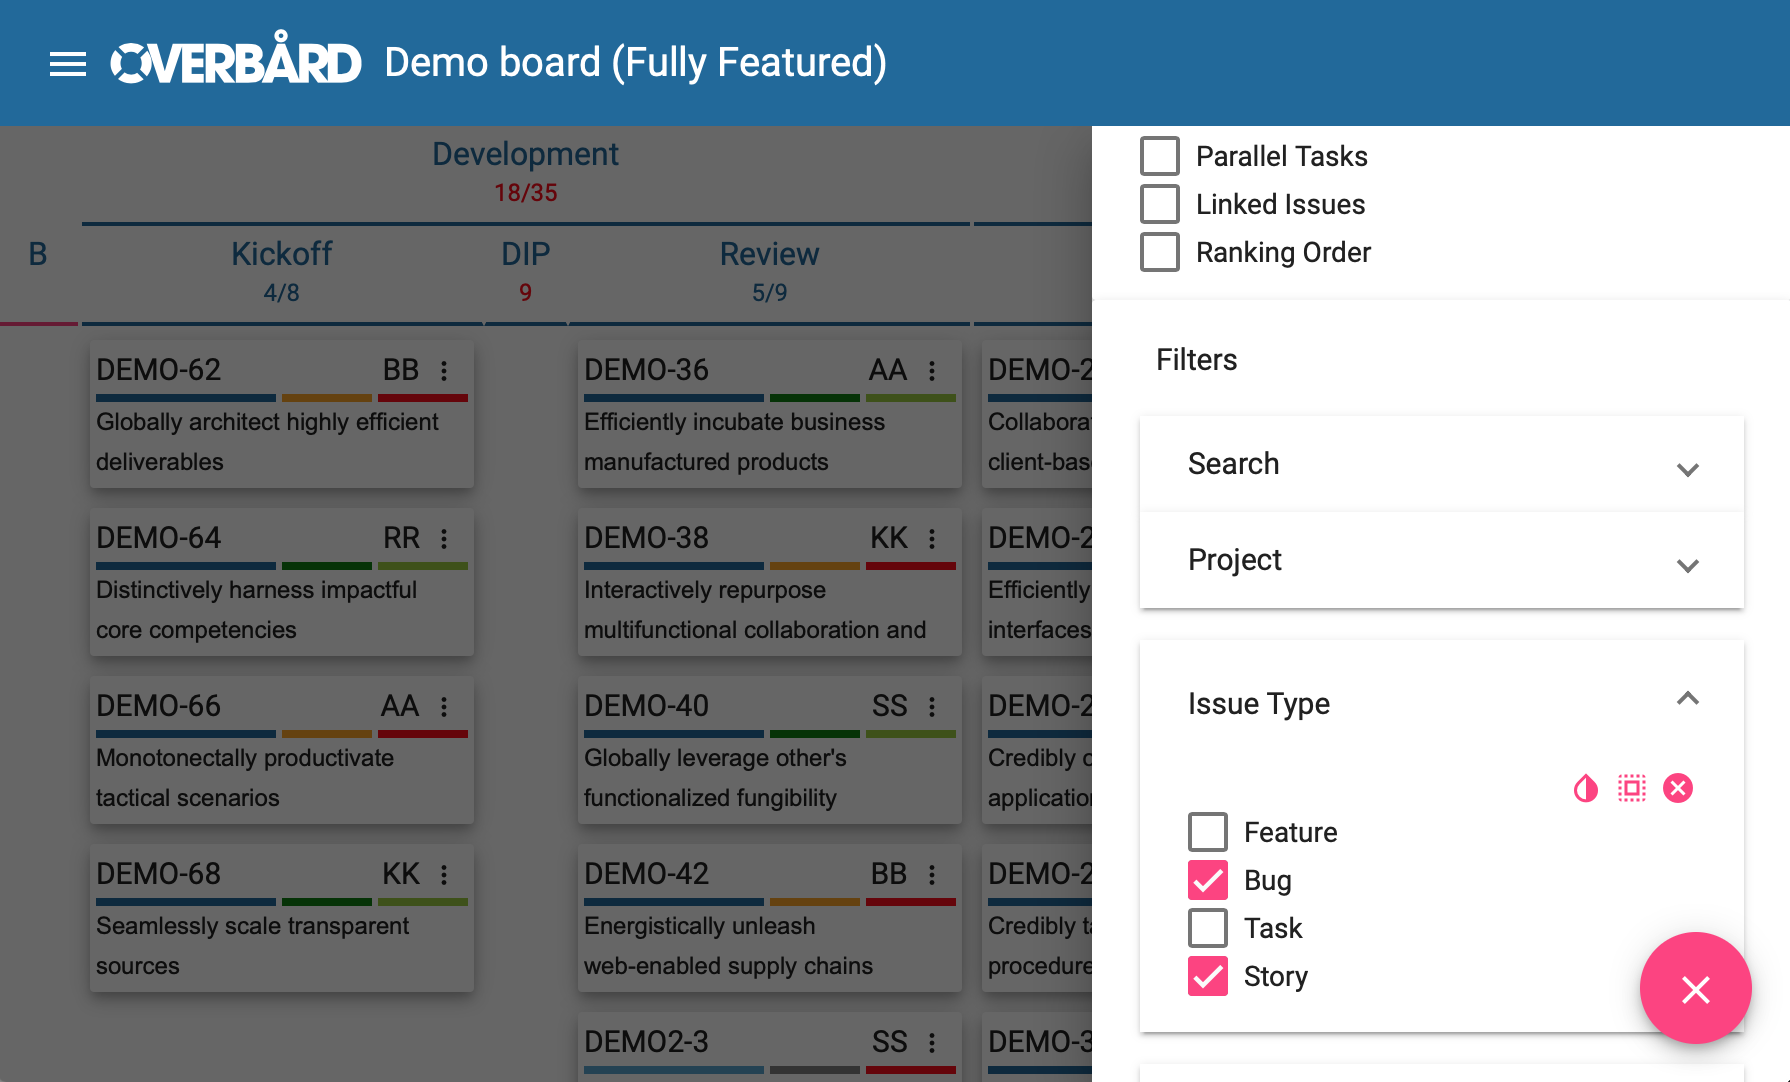
Only issues that have issue type Bug OR Story will be shown. Across the filter types there is an AND relationship.
So if you leave issue types Bug and Story selected and choose priority Major:
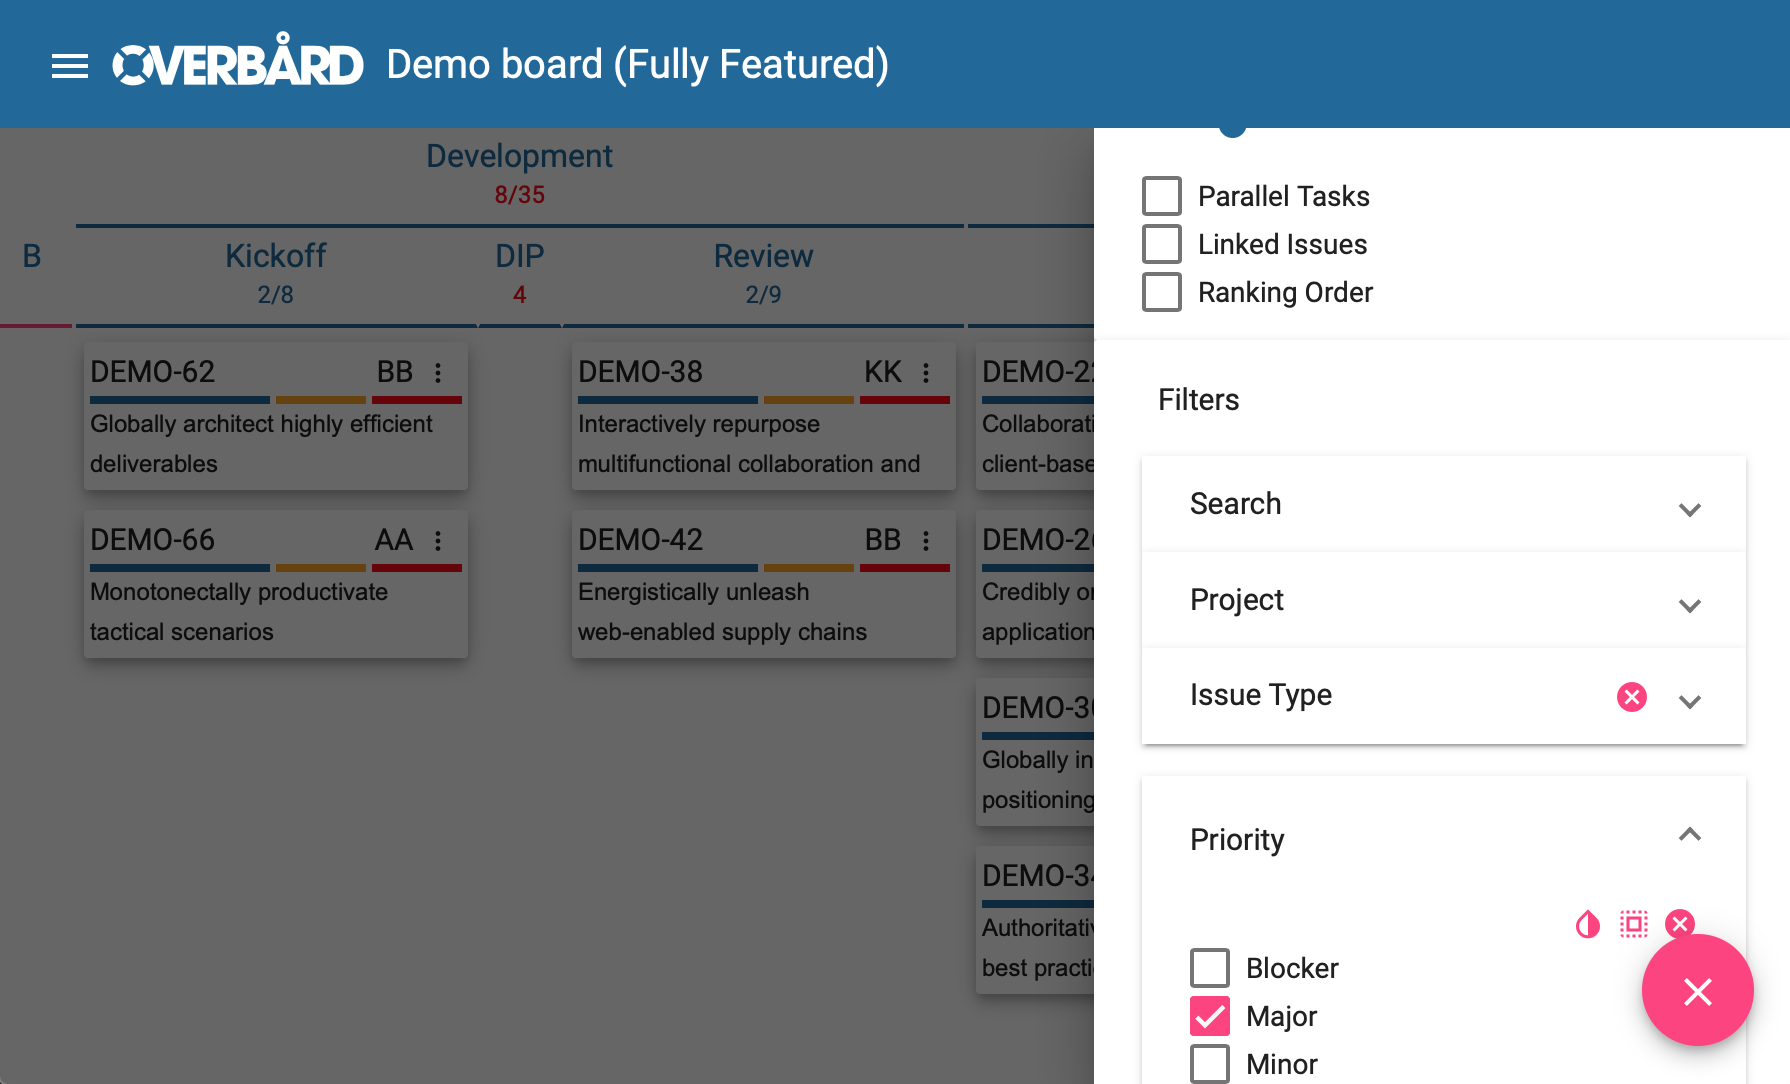
we end up with less issues because the query behind the scenes becomes something along the lines of:
(issueType = 'Bug' OR issueType = 'Story') AND priority = 'Major'
In the previous image it is worth pointing out the icon next to Issue Type in the collapsed filter entry. This
indicates that some filters have been set, and if you hover over the filter name, you will see which filters have
been set without needing to expand it again. If you click on the icon, it will clear the Issue Type filters.
Similarly, in the open Priority filter entry the three icons allow you to:
- invert the selection
- select all filters (which is effectively the same as selecting none)
- clear the filters
Note that for filters for fields in Jira that allow a null value (such as Assignee, Labels,
Components etc.) there is a special filter value called None, which allows you to pick out issues which do not
have the field in question set.
In addition the Assignee filter has a Current User option, which allows you to quickly pick out your issues.
2.3.3.1 Taming long filter lists
If the list of settable values for a filter is long as shown here, you will need to scroll to see all filter values:
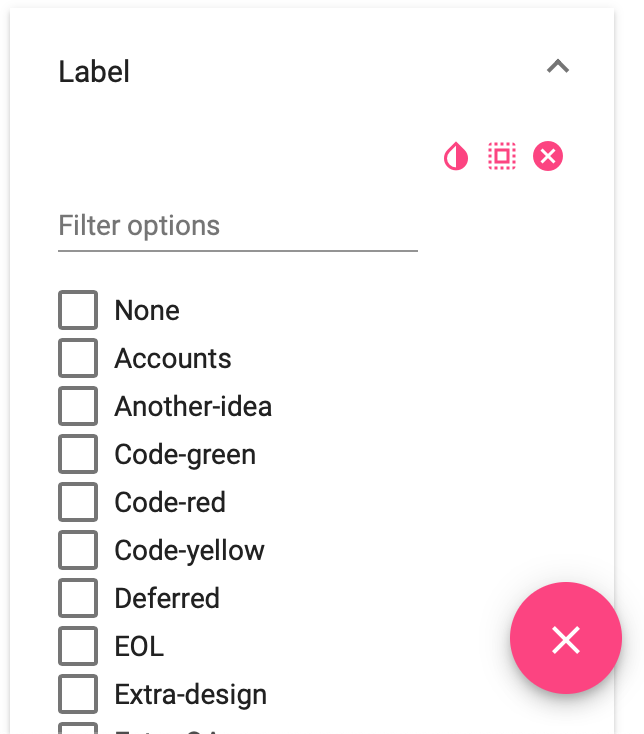
In these cases a search box appears above the list of filter values. If you know the name of the filter value you want to set, you can search for it:

2.3.3.2 Search and Issue QL
A special case of filter is Search, which appears at the top of the filters list. The standard setting greys out
the issues that do not match the search:
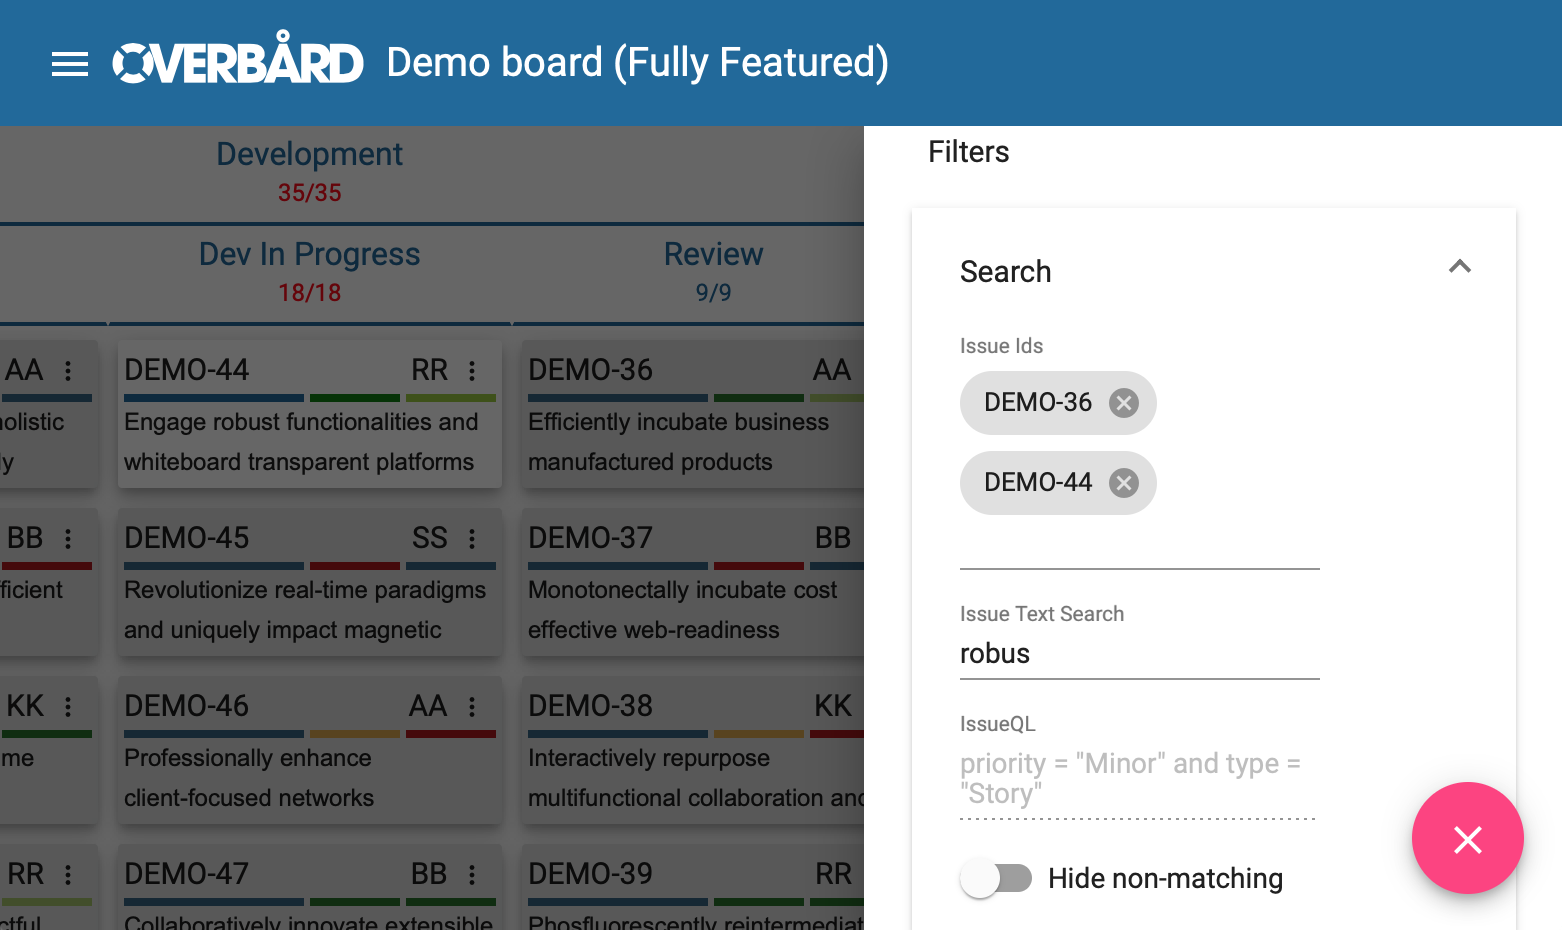
As you can see we are looking for issues where the issue id is DEMO-36 or DEMO-44, where the summary also
contains the text robus. For the Issue Ids field suggestions for issue ids are presented as you type into the
field. The Issue Text Search box must contain at least three characters for it to have any effect.
There is also an Issue QL field that you can use to enter more advanced queries, see the Issue QL Guide for more details.
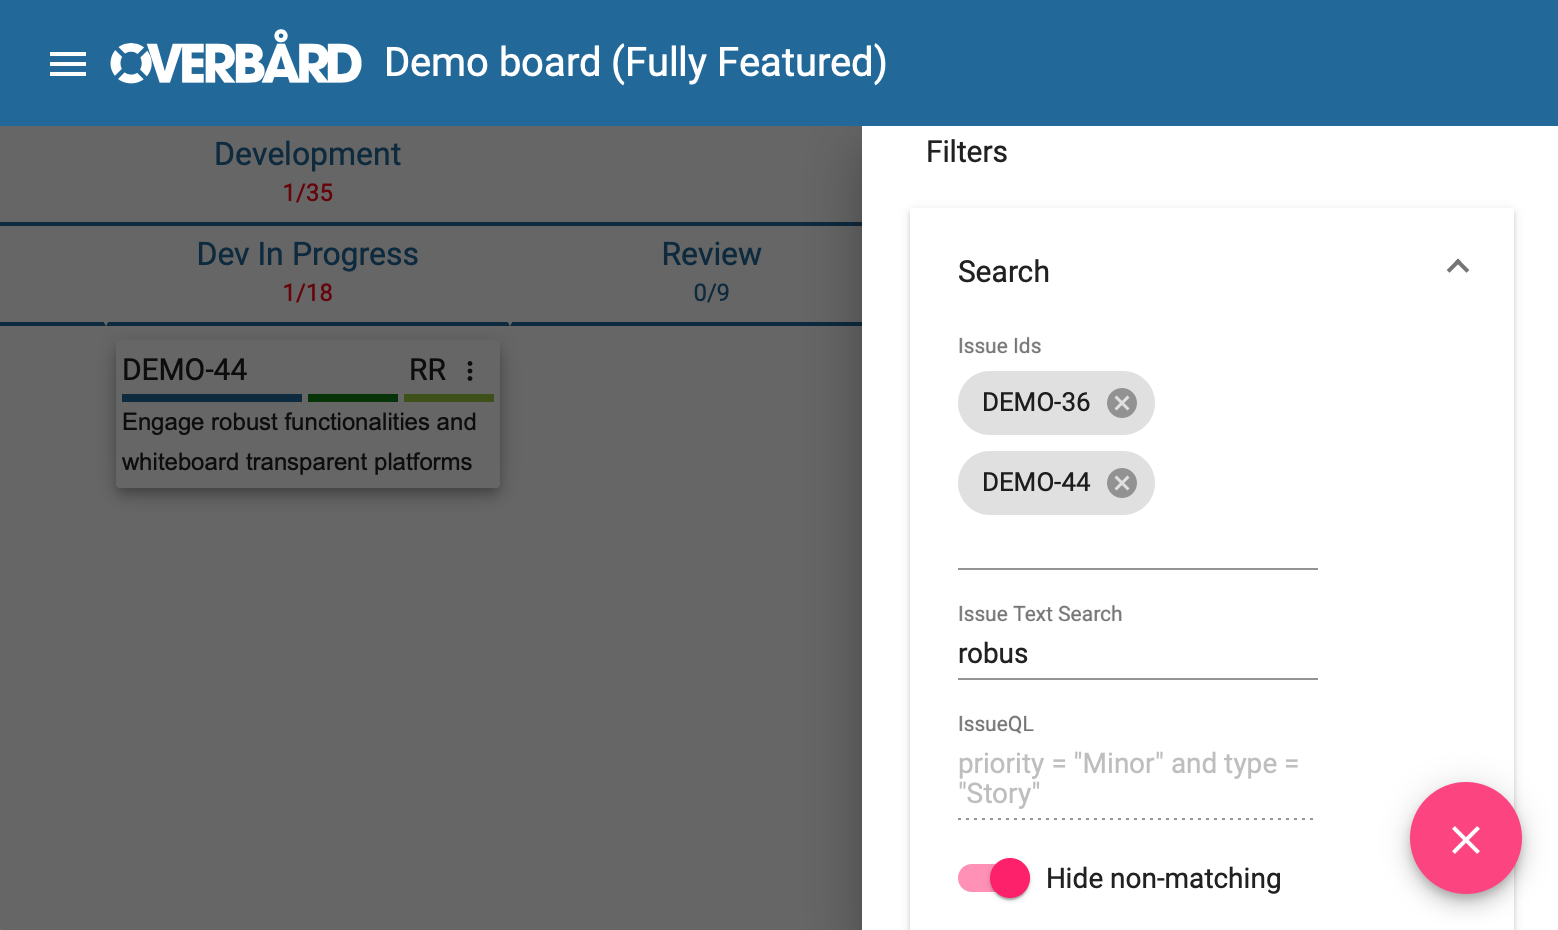
The final Hide non-matching toggle, if set, makes the search behave more in line with normal filters by hiding,
rather than greying out, non-matching issues:
2.3.3.3 Filters and swimlane
You can combine swimlanes and filters. The below image shows the board arranged in swimlanes by priority, but only showing the minor issues. Since we are not showing any of the other priorities their swimlanes are completely hidden on the board:
We can prove this really is the case by collapsing the Minor swimlane:

2.4 Issue cards
Let’s take a look at an issue card in detail:
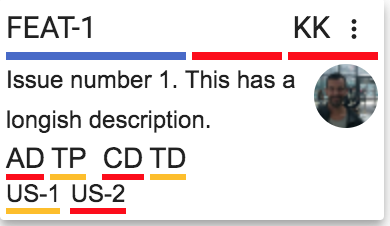
The top line contains the issue’s Jira id (FEAT-1), the assignee initials (KK) and a button to open the
issue context menu. If you hover the mouse over the Jira issue id, a tooltip will display the full information
about the issue.
Then we have a line with three coloured sections. The first is the colour configured for the project (boards can be configured to show more than one project). The second represents the priority of the issue, and the third the issue type. If you hover your cursor over one of these a tooltip will show the meaning of the colour.
The main section of the card contains the issue summary, and an avatar for the assignee on the right.
The AD, TP, CD and TD entries are called Parallel Tasks. Not all boards are configured to have these, but on
boards that have these they represent the completeness of a subtask that must be done as part of an issue’s
workflow. The colour for each ranges from red (not started) to green (done), Think checkboxes on steroids!
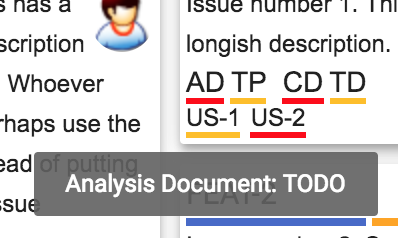
If you hover over each of these a tooltip will give the full name of the parallel task and its state.
e.g. we can see that the AD one means Analysis Document, and its state is TODO:
Finally we have a line containing the linked issues. For our card we list US-1 and US-2. This means that our
issue has links to these issues. Note that not all linked issues are shown, just ones for projects and issue types
the administrator set up.
Now we will explore some of the areas of the issue cards which need to be covered in more depth.
2.4.1 Issue context menu
Clicking on the icon in the top right of an issue you get the context menu. It currently allows you to Move (Kanban view), or Rank (Rank view), as well as comment on issues.
2.4.1.1 Move
Moving an issue means moving it to another state. If you click on the ‘Move’ issue context menu item you get presented with a list of the states the issue can move to:
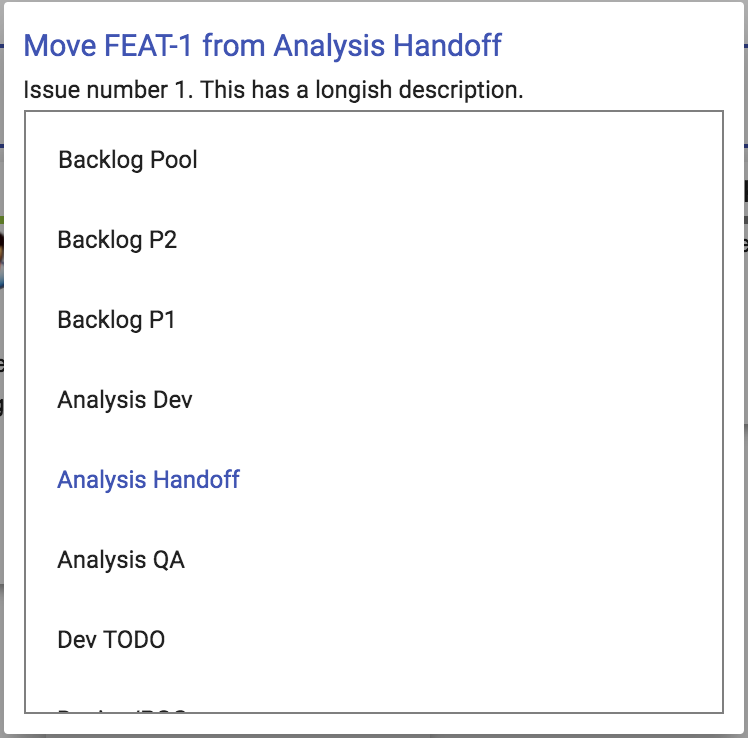
The list shows all the states this issue can move to, with the current state highlighted. The list is scrollable.
Note that Overbård assumes a workflow that allows moving to any state. If your Jira project uses a workflow that has some restrictions on state movement, an error message will be displayed if you attempt to make an illegal state transition.
This option is currently only available in the Kanban view.
2.4.1.2 Rank
This option is only available in the Rank view, and only if you are logged in as a user who has permissions to perform ranking in the Jira project (this is configured in Jira itself, not in Overbård). If you are one of the lucky ones who can rank issues, after clicking on the ‘Rank’ issue context menu item you will get a list containing all the issues from that project:
![]()
The issue being ranked is highlighted. To rank it click on the issue you want to move it before.
2.4.1.3 Comment
The ‘Comment’ issue context menu item will display a dialog allowing you to comment on the issue without opening the issue in Jira:

2.4.2 Parallel tasks
Note that these are only visible for boards that have been set up to use them. The parallel task icons are backed by drop down list custom fields in Jira, so although they are shown in Overbård the data is stored in the Jira issue using standard Jira mechanisms, and is visible in the native Jira issues themselves.
To change the value of a parallel task in the issue we have been using as an example, click on it. In this case I have
clicked TD (aka Test Development) and am presented with a pane to change its value. The current setting is
highlighted, and all the possible values are listed with a colour on a scale from red (not started) to
green (complete). If you hover over one of the colours a tooltip is displayed giving the name of the value.
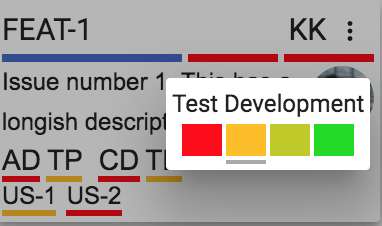
To change the value, click on the entry you wish to change the parallel task to.
3.0.0 Board updates
When you first load the board a full refresh of the board happens. Meaning the full contents of the server-side cache of the board get serialised to the client in a format the client needs to display the board. This cache is shared among all clients and lives in the server part of the Jira pluging. The Jira plugin also installs a Jira SDK event listener that is used to handle the events that are exposed by Jira to update the cache as issues are moved, and have their data changed etc. The client then pings the server every few seconds asking for the changes, which it then applies to update the view.
Despite our best efforts to handle as many events as possible, in some cases Jira does not expose the changes as events that can be handled via the SDK. And in a handful of other cases, we have left out trying to handle events for data that is rarely changed. However, the server-side cache is thrown away every 10 minutes, meaning a full reload happens when a client asks for the changes. After this full reload, all the data (including the things we don’t handle via the event listeners) will be up to date. So in summary most changes are reflected immediately on the client, while for some parts there can be a few minutes delay.
The list of ‘delayed’ data is:
- Epic link/name changes
- Links to parent issues
- Links to linked issues
- When an issue is changed in such a way that it was not part of the results used to load the cache, and it now
would have become part of the cache (say if you have a query filter to load all issues with
Fix Version=1.0.1, issueTST-123hasFix Version=1.2.0, and you changeTST-123to haveFix Version=1.2.0. In this case you will have to wait until the periodic full refresh of the server side cache to happen until you seeTST-123on the board in question).